Common Strategies
Overview
One of the most important aspects of becoming a successful trader is understanding that there is no single strategy that works in every market condition. Option traders have access to a wide range of strategies, including long calls, long puts, cash-secured puts, covered calls, credit spreads, debit spreads, iron condors, calendar spreads, diagonal spreads, and many others. Each strategy offers a unique balance of risk, reward, probability, and capital requirements, making certain strategies more suitable for specific market environments than others.
Rather than attempting to master every available strategy, successful traders often focus on developing a small number of strategies that align with their objectives, risk tolerance, and market outlook. By thoroughly understanding how these strategies work, when to deploy them, and how to manage them effectively, traders can build consistency and confidence in their decision-making process.
Trading success is rarely the result of finding the perfect trade. Instead, it is often the result of executing a well-defined strategy repeatedly over hundreds of trades while maintaining discipline and proper risk management. Developing a handful of proven strategies and applying them consistently allows traders to evaluate performance, refine their approach, and build a repeatable process that can withstand changing market conditions over time.
Below we explore some of the most popular, common, and utilized trading strategies!!
Call Options
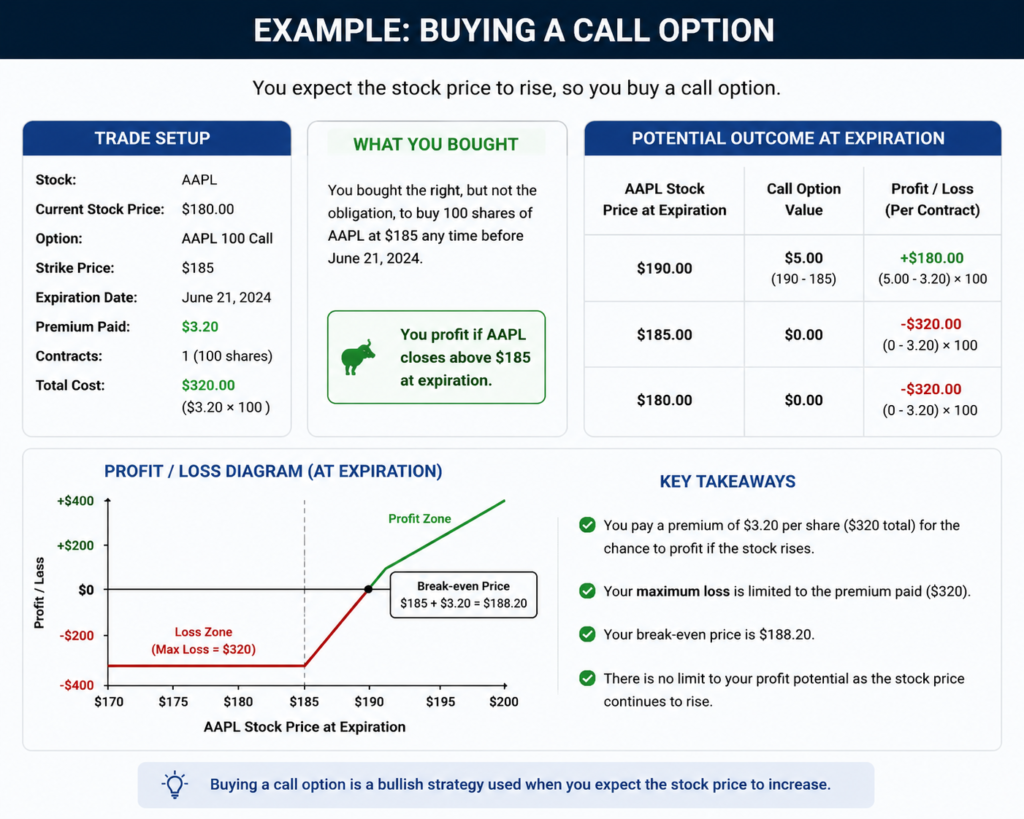
LONG CALLS is an options trading strategy where you buy a call option, giving you the right but not the obligation to buy a specific number of shares of an underlying asset at a set price (the strike price) before a certain date (the expiration date). This strategy is used when a trader is bullish, believing the asset’s price will rise significantly before the option expires. The buyer pays a premium for this right, which is also the maximum amount of money they can lose.
In the example below, imagine you’ve got a hunch that Apple, currently priced at $180, is going to soar in the next month because of an upcoming product release. You buy a Call option, at a strike price of $185, and this cost you $320 for one contract. This contract gives you the right to buy shares of Apple at $185 each, no matter how high the price rises. By June 21st, the date of the expiration, the price of the Apple Stock needs to rise to at least $188.20 before you start making money. If price does not reach this level by June 21st, then you will have a loss. The most you can lose is the amount of the premium paid in this case $320. You can also sell the options contract for a profit instead of exercising the option.
Covered Call Options
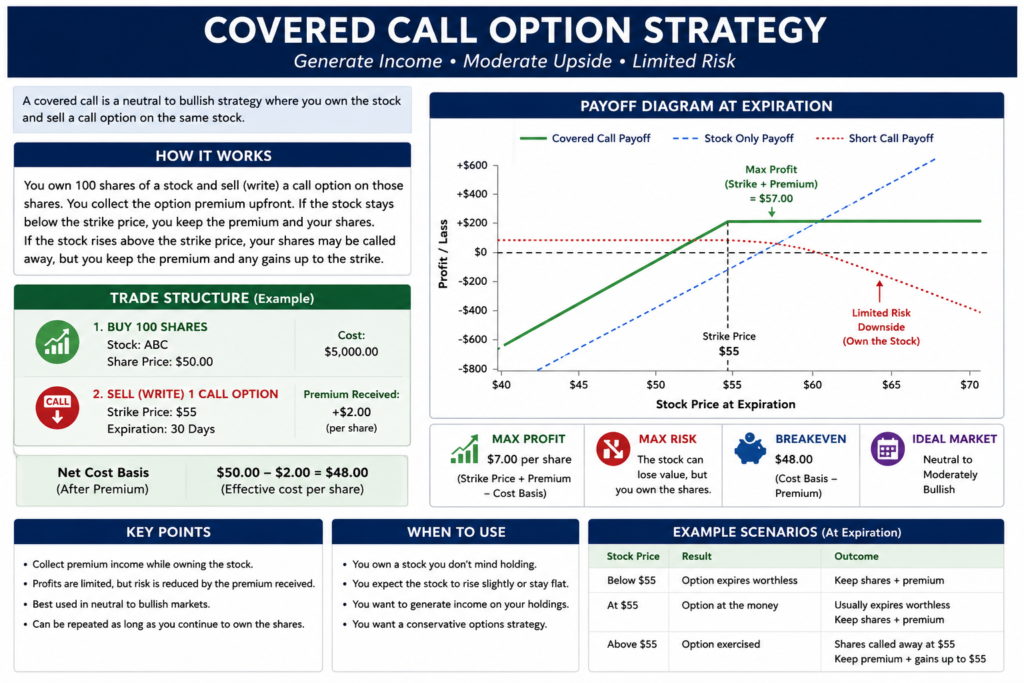
COVERED CALLS are one of the most widely used option strategies for investors who already own shares of a stock and wish to generate additional income from their holdings. The strategy involves owning at least 100 shares of a stock while simultaneously selling (or writing) a call option against those shares. In exchange for selling the call option, the trader receives an option premium, which provides immediate income and helps reduce the overall cost basis of the stock position.
Covered calls are generally used when a trader has a neutral to moderately bullish outlook on a stock. If the stock price remains below the option’s strike price through expiration, the call option will typically expire worthless, allowing the trader to keep both the option premium and the shares.
If the stock price rises above the strike price before expiration, the shares may be called away (assigned) at the strike price. Although this limits further upside potential, the trader still retains the option premium along with any appreciation in the stock up to the strike price. For many investors, this represents a satisfactory outcome because the trade achieved its predefined profit objective.
Covered calls are popular among long-term investors seeking to generate consistent income from stocks they are willing to own. When combined with sound stock selection, disciplined risk management, and appropriate strike-price selection, covered calls can be an effective strategy for enhancing portfolio returns.
Cash Secured Put Options
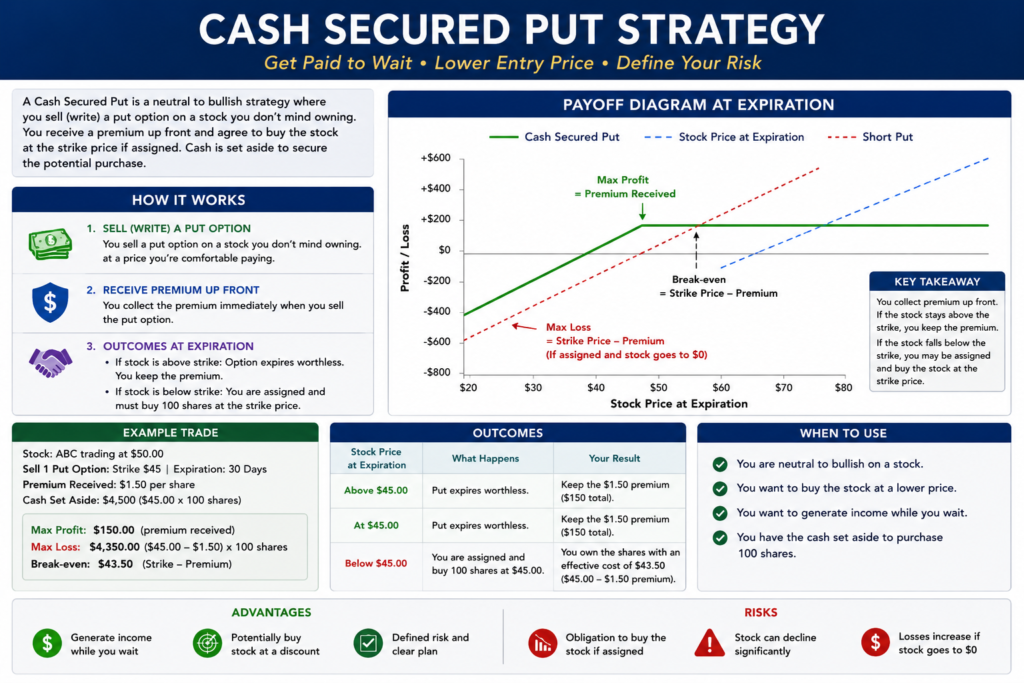
CASH SECURED PUTS is an options strategy where an investor sells a PUT option while setting aside enough cash to buy the underlying stock at the strike price. This strategy can be used to generate income from the option’s premium, with the goal of either collecting the premium or buying the stock at a desired lower price. If the stock price stays above the strike price, the put option expires worthless, and the investor keeps the premium. If the stock price falls below the strike price, the investor is obligated to buy the shares at the strike price, but the premium received effectively lowers the purchase cost.
If the option is assigned, and you are obligated to buy the stock at the strike price, think of this as effectively purchasing the stock at a discount. Since the funds are set aside to buy the stock if assigned, the risk is limited to the difference between the strike price and the cash set aside, minus the premium received. Cash Secured Puts require “cash” to secure the trade. If you have a moderate to large trading account then you probably have the cash needed to execute this type of trade. If you have a small trading account then a Cash Secured PUT may not be the best option, but it is worth considering.
Although considered one of the more conservative option strategies, a cash-secured put still carries risk. If the stock declines significantly below the strike price after assignment, the investor will experience unrealized losses on the shares, partially offset by the premium received. For this reason, traders should generally use this strategy only on companies they are willing to own for the long term
Credit / Debit Spreads
CREDIT / DEBIT SPREADS are a great option trading strategy as it requires less capital to secure a trade. Whereas Cash Secured Puts require a set aside of resources to buy a stock in case price reaches the Strike Price, Credit Spreads require only the difference between the Strike Prices that are chosen.
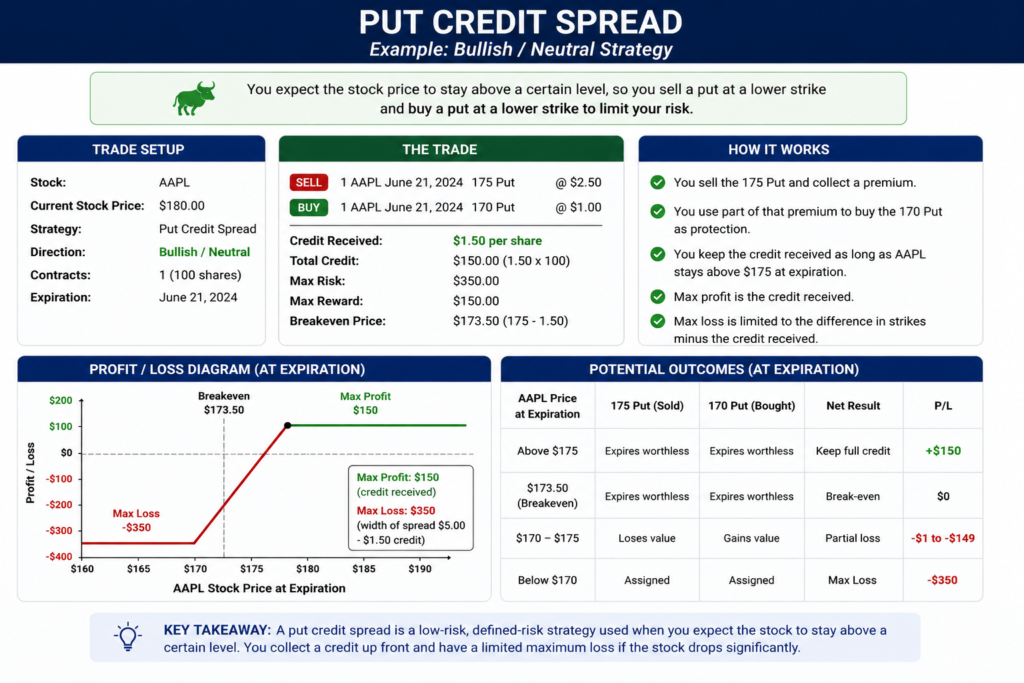
Put Credit Spreads, also known as a Bull Put Spread, involves selling a put option at a higher strike price and buying another put option at a lower strike price, both with the same expiration date. It generates an initial credit, hence the term “credit.” The net credit is the difference between the premium received from the short put and the premium paid for the long put.
The maximum profit is the net credit received, which is achieved if the stock price is above the higher strike price at expiration. The maximum loss is the difference between the strike prices minus the net credit received. There are different types of CREDIT/DEBIT SPREADS. The reference to Debit and Credit is what will happen to your account depending on the strategy chose. For Example, a Bull Credit Spread will show up as a credit on your account when you place that trade.
In the example below, a PUT Credit spread involves selling a PUT option, in this example at a strike price of $175, and buying a PUT option at $170. When you sell a PUT, you receive a premium and when you buy a PUT you pay for that PUT option. Here, the goal is that price will be above $175 at expiration and if that occurs you simply walk away with the net credit you received.
Iron Condors
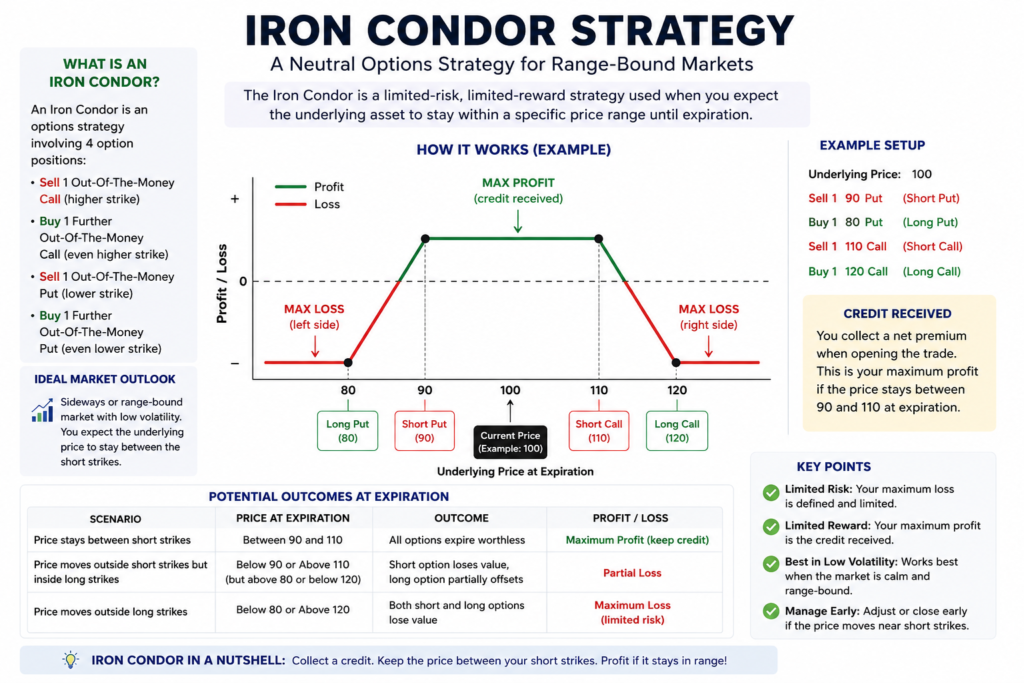
IRON CONDORS are popular and is generally viewed simply as a combination of two vertical spreads—a bear call spread, and a bull put spread. This strategy has four different option contracts, each with the same expiration date and different strike prices.
To construct an iron condor, you sell an out-of-the-money call, and an out-of-the-money put, while simultaneously buying a further out-of-the-money call and a further out-of-the-money put.
The primary benefit of the iron condor strategy, compared with other low volatility options strategies, is that it typically generates a larger net credit for the same risk. If you think an underlying security’s price will not move much by the expiration date and want to limit risk then could consider an iron condor.
For example, if a stock is trading at $100, an iron condor could be constructed by selling a $90 put and selling a $110 call, while buying a $85 put and a $115 call. The goal is to profit if the stock stays between the Short Put ($90) and Short Call ($110) until expiration, allowing the investor to keep the initial net premium received.
TRADING NOTE (ASSET CHOICES)
Please note, certain types of stock assets work better with different option strategies. In other words, Iron Condors do not work well with every stock. Consider using Iron Condors sparingly on individual stock assets and stick primarily with ETF’s where you can avoid Gaps in pricing, experience tight spreads, and where liquidity is not a problem. Below are a few good candidates for the Iron Condor:
- SPY (S&P 500 ETF) – Tight spreads, low gap risk, good choice for a weekly condor
- QQQ (NASDAQ 100 ETF) – Higher volatility than SPY, results in higher premium
- IWM (Russel 2000 ETF) – Slightly more volatile than SPY resulting in bigger credits
- DIA (Dow Jones ETF) – Slower moving index, usually range-bound as compared to tech
- TLT (20+Year Treasury ETF) – Interest rate driven, often sideway price action
- GLD (Gold ETF) – Often trades in ranges, lower correlation to equities
- APPL (Apple) – Massive liquidity, controlled movement
- MSFT (Microsoft) – Like Apple, stable and contains a lot of institutional capital
TRADING NOTE (IRON CONDOR TRADE MANAGEMENT)
It is important to note with Iron Condors there is trade management involved. Below are some trading insights to consider:
- Wing Width = $2 to $5 width (From the Short Strike Prices, especially on the call side, because greater the wing width equals greater risk)
- Short Strike Delta typically range between 0.05 to 0.15 (Larger the delta means greater risk of being OTM)
- Take Profits = Range 50% to 75% (This will ensures you exit the trade before it has time to go south)
- Place alerts on your charts between Short Strike prices alerting you that price is approaching the Strike price
- A breach of the short call strike does not automatically mean the trade has failed—but it does require disciplined evaluation. Successful traders will (1) Assess the strength of the move (2) Evaluate the time remaining until expiration (3) Determine whether a roll adds value
- Rolling to a later expiration should only be considered if it generates a meaningful net credit. A roll should be viewed as initiating a new trade—not simply postponing a loss.
Diagonal Strategy
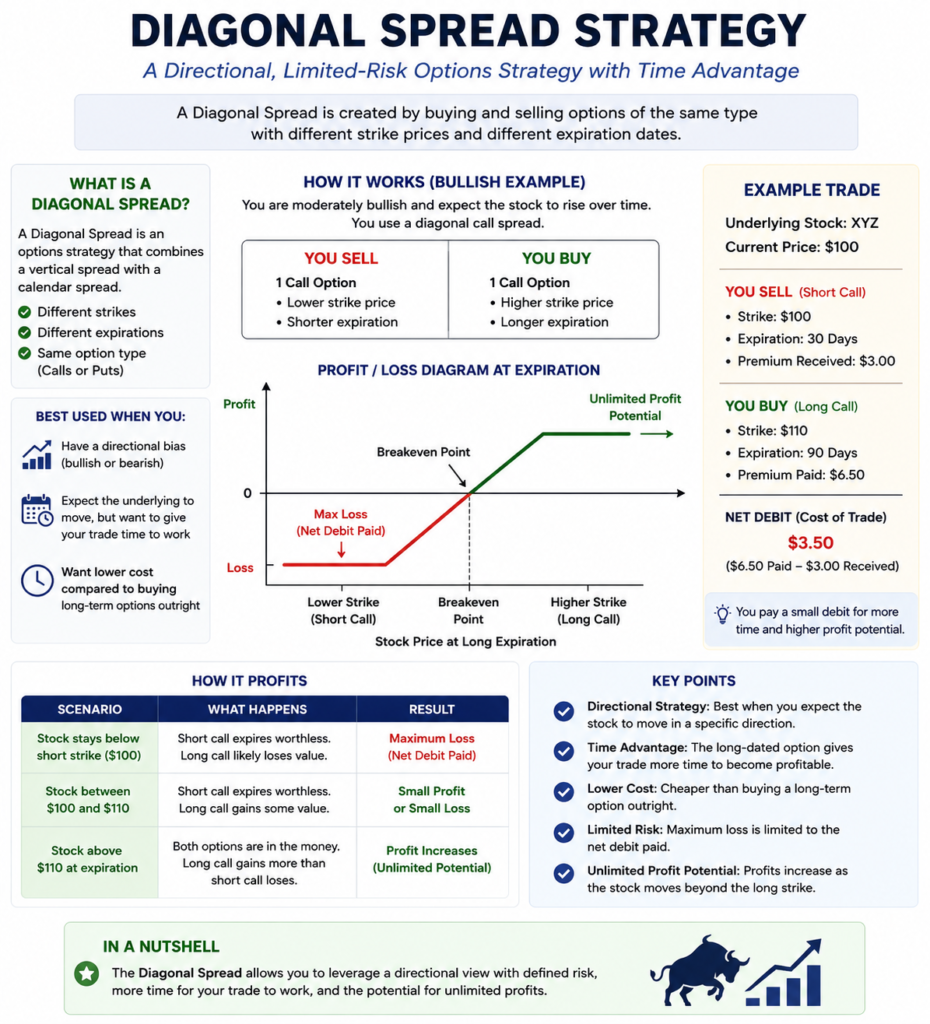
DIAGONAL is a strategy that combines elements of both a vertical spread and a calendar spread by simultaneously buying one option and selling another with different expiration dates and different strike prices. These trades can be used to profit from time decay, volatility changes, and favorable price movements. This is a nice strategy for small trading accounts as you do not need much capital to secure this trade.
For example, a two-month (56 days to expiration) $85 Call is sold, and a one-month (28 days to expiration) $90 Short Call is purchased. This strategy will result in a net credit. The maximum profit is realized if the stock price falls sharply below the strike price of the short call. This strategy is appropriate when the forecast is bearish for that stock.
The most common approach is to close the long option when the short option expires. The short option will likely expire worthless, if it’s out-of-the-money, allowing you to sell the long option, which should still have some time value.
If the short option is in-the-money as it approaches expiration, you may want to close the position to avoid being assigned the underlying shares. This is especially important during “gamma week” (the last week before expiration) when the option’s value increases or decreases rapidly.
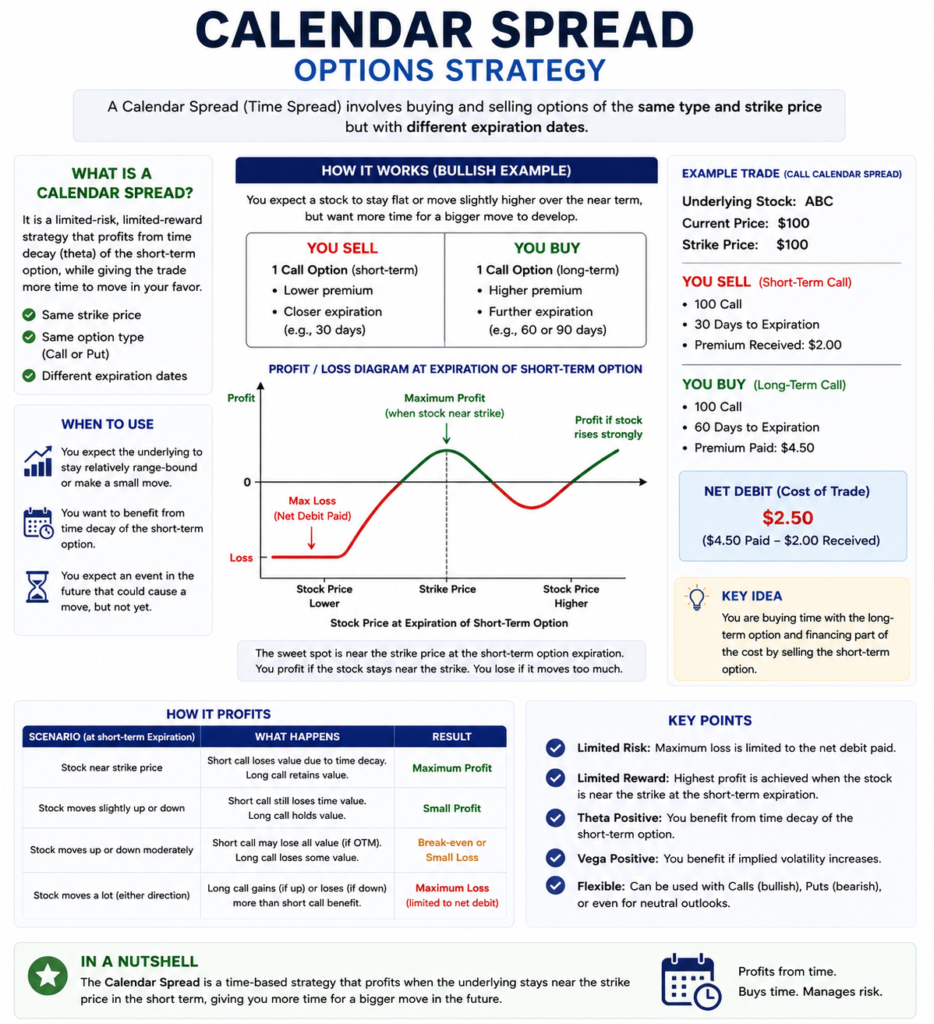
Calendar Spread
CALENDAR SPREAD is an options strategy where you simultaneously buy a longer-dated option and sell a shorter-dated option with the same underlying asset and strike price. The goal is to profit from the faster time decay (theta) of the short-term option, ideally when the underlying asset’s price remains stable or moves very little until after the short-term option expires. Calendar spreads are a good strategy for large and small trading accounts.
One of the primary advantages of a calendar spread is that it allows traders to benefit from the accelerated time decay of the short option while retaining the longer-dated option as a potential source of future value. The strategy generally has defined risk, with the maximum loss typically limited to the initial cost of establishing the position. Calendar spreads can be employed in neutral, moderately bullish, or moderately bearish market conditions, depending on the strike price selected and the trader’s outlook.
Successful calendar spread traders pay close attention to factors such as implied volatility, time to expiration, and the expected movement of the underlying stock. A simple way to think about a calendar spread is: “Sell time that is decaying quickly and buy time that is decaying slowly.” The goal is for the short-term option to lose value faster than the longer-term option you own.